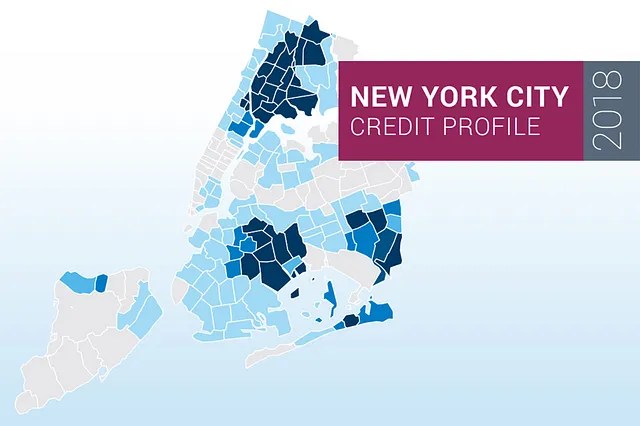
New York City has one of the weakest credit inclusion rates in the nation, according to a recent New York Fed report. Data in our New York City Credit Profile show that 22.2% of city residents were not included in the credit economy as of the fourth quarter of 2017. That means over 1.5 million adults were without a credit file or a credit score and without ready access to mainstream financial lenders.
The New York Fed’s New York City Credit Profile provides detailed credit data, maps, and analytics for New York City as a whole, for each of its five boroughs, and for its 184 zip codes. Viewed together, a rich picture emerges of the city’s credit well-being and the gaps in credit opportunity in its neighborhoods, especially the 118 neighborhoods identified as among the most severely credit-constrained in the nation. The analytics are useful to direct the right types of resources to neighborhoods in need, to align and evaluate community programs to achieve the highest social impact, and to measure progress over time.
Community Credit Framework
Access to credit is a portal to financial security and economic opportunity for households and communities, yet credit access gaps persist nationwide. Even municipalities that are thriving economically, like New York City, are made up of a mix of credit-sufficient and credit-constrained neighborhoods.
The central premise of the report’s analytics is that financially secure households are a source of strength and stability for their community, and that a community’s well-being and resiliency may be gauged by their presence.
Access to credit for economic opportunity is a complex issue with no simple data measure. Individuals may have institutional access to credit but lack access to credit that can enhance economic opportunity for themselves, their families, and their communities. Accordingly, the analysis takes a multi-factorial approach where a dozen indicators are examined in clusters to identify three credit access gaps: (1) weak credit inclusion — or too few residents with access to mainstream credit; (2) weak borrowing capacity — or too few residents with credit limits or credit scores that allow for easy or favorable credit approvals; and (3) poor debt payment histories — or too many residents in the community who are late paying their debt obligations during the past year. For more on the framework and how to interpret the analytics, see our previous posts on our community credit profiles of Rochester and of Long Island.
Takeaways
- While all boroughs have shared in New York City’s credit recovery following the financial crisis, some have had a stronger recovery than others. Among the boroughs, Manhattan generally has the strongest credit indicator scores, while the Bronx has the weakest.
- Among the 118 credit-constrained zip codes, the most prevalent credit gap is low credit inclusion. These 71 neighborhoods are located in all five boroughs, with Brooklyn and Queens having the largest clusters. Typical of this group are the Long Island City zip codes 11102, 11103, and 11106, where a mix of credit-constrained residents live side by side with credit-sufficient and credit-thriving residents. The analytics suggest that these zip codes may be in an economic transition and are ripe for policy interventions and business opportunities. In the near term, credit literacy programs that build financial skills might yield positive results that deepen the pool of creditworthy customers for businesses. Credit products suited to residents’ lifestyles are a business opportunity, especially if the credit-excluded residents are relying on high-priced alternative lenders to meet their credit needs.
- The second-largest group of credit-constrained zip codes (31) show all three credit gaps — low credit inclusion, low credit capacity, and high and persistent debt payment problems. These zip codes are located mostly in the Bronx (17) and Brooklyn (7). From a policy perspective, two distinct dynamics are likely in effect in these neighborhoods. First, there is the large share of local residents not connected to mainstream financial lenders. Second, a separate but compounding challenge is the number of residents who are in the credit economy but who struggle with their debt obligations and have little capacity to borrow further. The prevalence of delinquent debt histories suggests a gap in budgeting skills or issues related to insufficient income.
- There are also 12 zip codes where a combination of weak credit inclusion and pervasive long-term debt payment problems is depressing access to credit for economic opportunity. The credit inclusion gaps point to zip codes possibly in economic transition, similar to the first group of neighborhoods discussed. However, residents in the credit economy are struggling to make timely payments on their debt obligations, which suggests possible income insufficiency and the need for budgeting and debt management skills. Surprisingly, these zip codes do not have serious credit capacity issues; residents have credit cards with borrowing capacity and credit scores in the mid-tier range. In other words, there is capacity to borrow since credit scores are not pervasively low. It is possible that the debt payment problems are legacy issues, with residents in the process of paying off long-term delinquent debt. Alternatively, residents may be juggling credit products to remain afloat financially. These zip codes may be at a “credit tipping point” and ripe for policy and program interventions to assist residents in mending credit issues or to avoid tipping the community into a credit-distressed state.
Overall, these findings underscore the value of examining the micro-data analytics to understand credit gaps among neighborhoods. The experiences of New York City residents vary considerably, and targeting policy interventions to the specific needs of a neighborhood can lead to better outcomes for communities.
This article was originally published by the New York Fed on Medium.
The views expressed in this article are those of the contributing authors and do not necessarily reflect the position of the New York Fed or the Federal Reserve System.


