


Last week, we released the City of Rochester Credit Profile, a prototype report for assessing economic well-being at the neighborhood level. It’s based on our Community Credit framework, and to understand what’s new and why this is significant, we’ll take a step back and explain the framework first.
About the Community Credit Framework
Over the past few years, the New York Fed has been looking at credit data by geography to assess community well-being. Credit access is a helpful measure of economic well-being because it means residents can get the resources they need in emergencies, or the funds they need for opportunities like starting a small business or accessing higher education. That’s why we created a set of indicators to track well-being over time. Our Community Credit framework makes state- and county-level measures of credit access publicly available.
What does it measure? It focuses on “credit inclusion” and “credit stress.” “Inclusion” gauges a community’s ability to access credit by measuring the share of individuals that have a credit file, have enough borrowing capacity, and are able to get affordable credit. Meanwhile, “stress” gauges how much communities are struggling financially by assessing residents’ payment histories.
Catalysts for the City of Rochester Credit Profile
Although we have used Community Credit in various ways since 2014, we understand that most people view a “community” as something much smaller than a county. In practice, programs and policies are designed for specific neighborhoods since wide variation in needs can exist within a single county or city.
The pronounced need for data at smaller geographies is matched by a glaring paucity of “micro data” — or data specifically relevant to local areas. Few indicators are measured at the community level, and those that do exist are often published with a time lag. Although policymakers are acutely aware of the challenges their communities face, they often lack the quantitative evidence to support their claims or make informed resource allocation choices. Such tools are essential for stakeholders to be able to gauge the needs of their communities and measure the impact of ongoing initiatives in a meaningful and fact-based way. Doing so requires relevant, timely, and targeted data.
In responding to these needs, we decided to implement our Community Credit framework for a smaller geography to really understand the credit health of a city and its neighborhoods. In our pilot study for Rochester, New York, we provide the following additions to our original framework:
1. City-level benchmarks. The first innovation is to provide Community Credit indicator values calculated for the actual city boundaries. City-level data are useful to gauge the well-being of a city in relation to the county, state, or region in which it is situated. The indicators can also provide initial flags for communities that may be in need of interventions.
2. Progress trackers. The indicators are also useful to understand what progress, if any, a given geography has made since the 2007 recession. Comparing the condition of a city today to 2007, we look to see whether it has improved, declined, or stayed the same for given measures of credit health. Such “progress reports” are especially helpful when areas seem to have larger credit needs, yet show improving credit health over time.
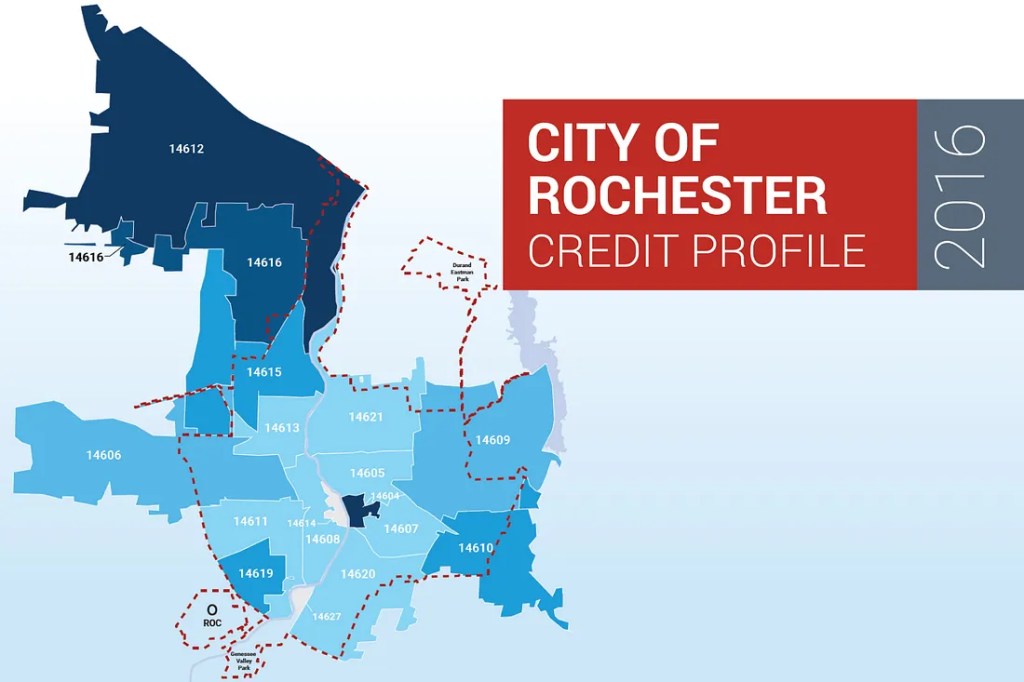
3. Detailed zip code maps. Perhaps most crucial to designing and assessing programs and policies targeting local areas or individuals, we map our indicators at the zip code level. Any zip code within or partially within our identified city receives a range of values for each indicator that can help stakeholders understand the credit needs of specific neighborhoods and where it may be most useful to allocate resources. These maps can show how cities vary in terms of credit access and health, and whether overall prosperity is truly being experienced by all, and not just some, communities. And over time, these maps may track the effectiveness of specific initiatives and progress for communities in need.
Key Findings in the City of Rochester Credit Profile
Our new credit profile shows that Rochester ranks among the lowest in the New York Fed’s district and the nation by various measures of credit access, but its situation has been improving since late 2007. However, the report also underscores a widely observed pattern: Overall prosperity is masking underlying inequality. Some neighborhoods — especially those around the central/downtown area — continue to lag in terms of access to credit. Most notably, we were able to identify a group of about 10 zip codes located in the central part of the city that rank among the lowest in the United States when measured by the various Community Credit indicators.
Uses of Community Credit and the City of Rochester Credit Profile
Community Credit is widely useful and the new credit profile’s neighborhood-level insight is particularly beneficial to community leaders, nonprofits and the public at large. Cities can use the tool to target financial counseling resources and understand the effectiveness of community programs. Community advocates can use it to promote financial resources and products that would be most suitable for individuals to build positive credit profiles and use credit sustainably. Nonprofits and foundations may use the data to give voice to individuals in underserved neighborhoods. And the tool can also be an educational mechanism for the public — empowering individuals with the ability to understand credit health and trends in their area, and how they may become sources of strength for their community. Through these combined advantages, strategies for promoting economic well-being and supporting the local economy will be more accurately targeted at areas of greatest need — benefiting communities overall.
For the 2016 data for the City of Rochester or an example of what our indicators can show, see our full 2016 report.
This article was originally published by the New York Fed on Medium.
The views expressed in this article are those of the contributing authors and do not necessarily reflect the position of the New York Fed or the Federal Reserve System.
