


The New York Fed today released the 2018 annual report of the System Open Market Account (SOMA). Issued to the Federal Open Market Committee (FOMC) for much of the Fed’s history, this report provides a review of open market operations conducted by the Open Market Trading Desk (the Desk), other developments that influenced the Fed’s portfolio of domestic securities, and developments in the Fed’s foreign operations. The SOMA represents the largest asset on the Fed’s balance sheet.
The New York Fed also released a new interactive that provides details about domestic securities holdings of the SOMA. The interactive allows users to explore the portfolio over time and cuts the data by variables such as time to maturity, issuer, term, and coupon rate. It will be updated monthly with new portfolio data going forward.
The FOMC continued to normalize the stance of monetary policy in 2018, by further raising the target range of the federal funds rate and gradually reducing the size of the Fed’s domestic securities portfolio according to the plan announced in 2017. This SOMA annual report covers developments during 2018, it does not feature more recent announcements by the FOMC on balance sheet normalization.
Below are selected highlights of the 2018 annual report, with graphics from both the interactive and the report itself.
The Fed Successfully Controls Short-Term Interest Rates in an Environment of Changing Money Market Dynamics
Relevant Report Pages: 6 to 12
During 2018, the Fed’s tools to control the level of the federal funds rate and other short-term interest rates — primarily the rate paid on excess reserves (IOER) held by banks at the Fed, supported by overnight reserve repurchase agreements (ON RRPs) — continued to be successful in keeping the effective federal funds rate (EFFR) well within the FOMC’s target range. This occurred despite substantial changes in the level of reserves in the banking system and significant changes in money markets.
Data from a range of money markets demonstrate that the Fed’s monetary policy implementation framework was successful in transmitting the FOMC’s monetary policy stance across a broad constellation of short-term interest rates. The dispersion between various unsecured and secured overnight rates narrowed in 2018 and converged within the upper portion of the target range.

Chart 5 from the Annual Report, depicting overnight rates’ dispersion within the federal funds target range.
During 2018, a variety of trading dynamics across money markets led to the bulk of federal funds transactions moving higher relative to the IOER rate. In particular, a significant increase in the issuance of Treasury securities contributed to higher rates on Treasury repurchase agreements (repos) higher. This made repos a more attractive investment for lenders in the federal funds markets, thus drawing some supply of funds away from that market. Increased demand for interest-bearing accounts offered by commercial banks to Federal Home Loan Banks further reduced the supply of federal funds by these lenders, adding upward pressure on the EFFR. At the same time, some borrowers increased demand for federal funds from regulatory-friendly lenders to improve their liquidity coverage ratios, and some smaller domestic banks competed for federal funds by borrowing at higher rates. These changes in demand dynamics for federal funds also added upward pressure on the EFFR.
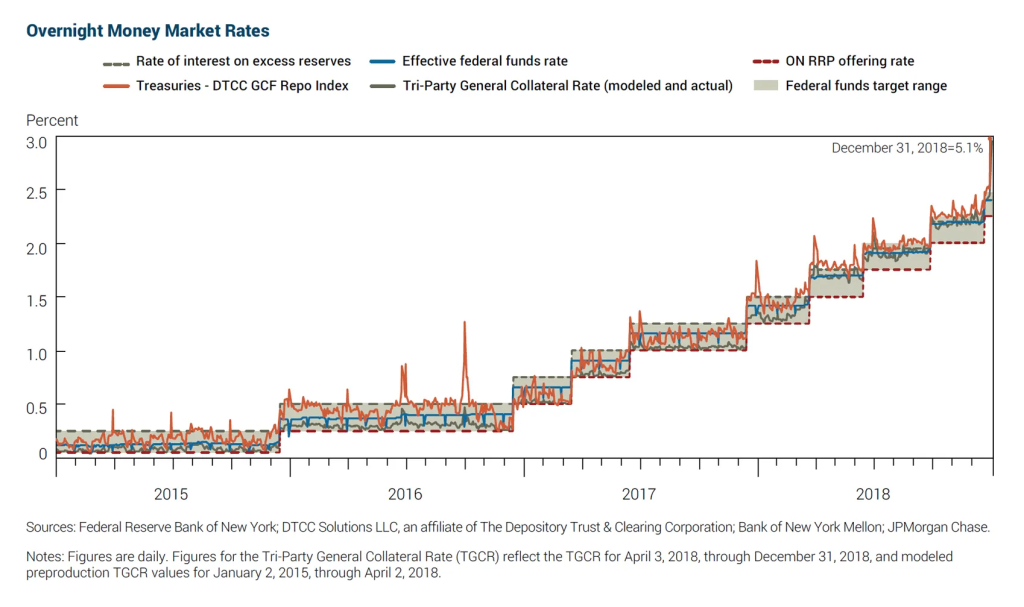
Chart 4 from the Annual Report, depicting overnight money market rates from 2015 through 2018.
With overnight money market rates generally rising relative to the IOER rate, the Federal Reserve made two technical adjustments in June and December, which placed the IOER rate below the top of the FOMC’s target range. This provided greater confidence that the EFFR would remain well within the target range even with the significant changes in money markets.
The Fed’s Balance Sheet: Its Size Declines due to Portfolio Runoff
Relevant Report Pages: 27–38
The size of the Fed’s balance sheet was $4.1 trillion at the end of 2018, representing about 20% of the U.S. nominal GDP. After reaching a peak of $4.5 trillion in fall 2014, and remaining around this level until late 2017, the size of the SOMA domestic securities portfolio declined by $380 billion during 2018 as the FOMC instructed the Desk to reinvest the principal payments received from securities held in the SOMA only to the extent that they exceeded designated monthly caps. At the same time, reserve balances held by depository institutions declined to roughly 43% of their peak levels of fall 2014.
To enhance understanding of how the overall size and composition of the Fed’s balance sheet can be affected by the Fed’s monetary policy actions and/or changes in the demand for some Fed liabilities unrelated to monetary policy, this year’s report includes a sidebar (Box 3 on Page 28). This sidebar visually illustrates the simple balance sheet mechanics of how various scenarios would play out across assets and liabilities.
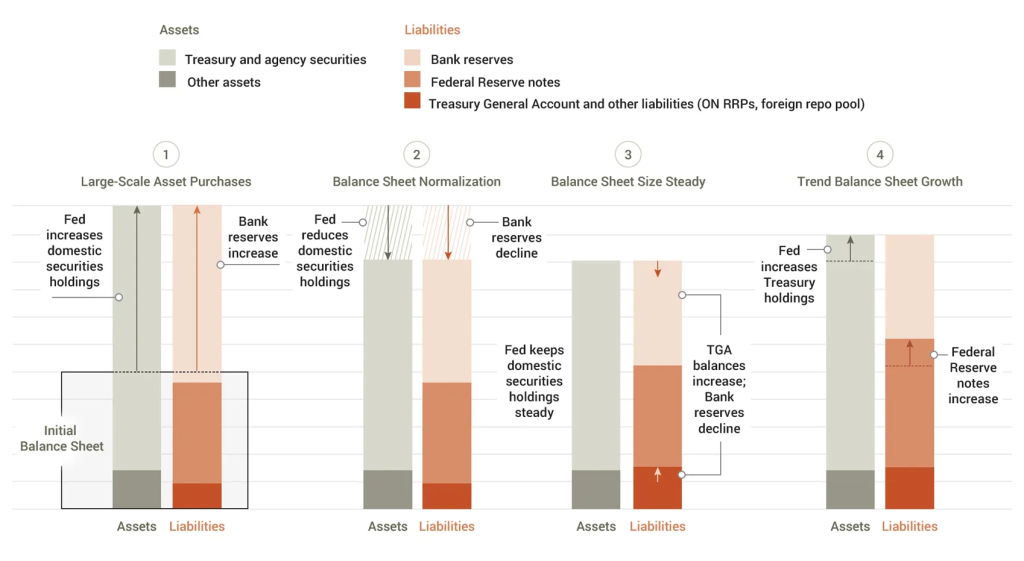
Box 3 from the Annual Report, depicting a stylized representation of shifts in the size and composition of the Fed’s balance sheet.
A Look at the Assets on the Balance Sheet
Relevant Report Page: 27–33
Starting with the asset side of the Fed’s balance sheet, over 2018 the domestic SOMA securities portfolio declined across each type of security, and at the end of the year its composition was 58% Treasury securities, 42% agency MBS, and less than 1% agency debt, similar to prior years.
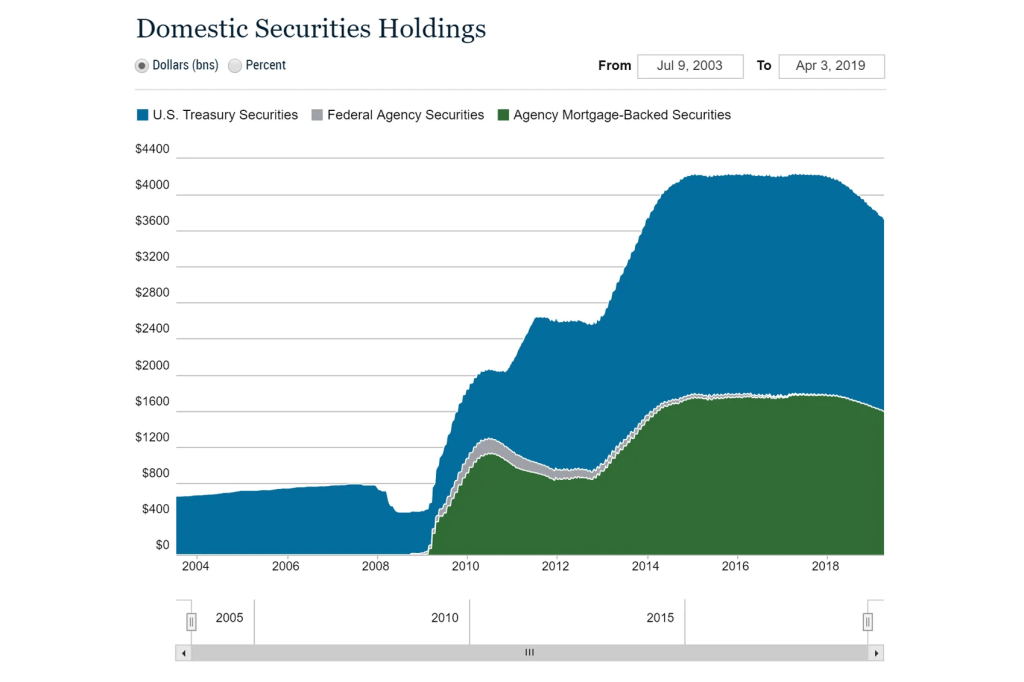
Chart from the New York Fed’s new interactive on the SOMA. This chart depicts total domestic securities holdings over time.
The weighted average maturity of the Treasury portfolio increased by 0.4 years (just under five months) as security redemptions left a larger proportion of longer-maturity securities in the portfolio.
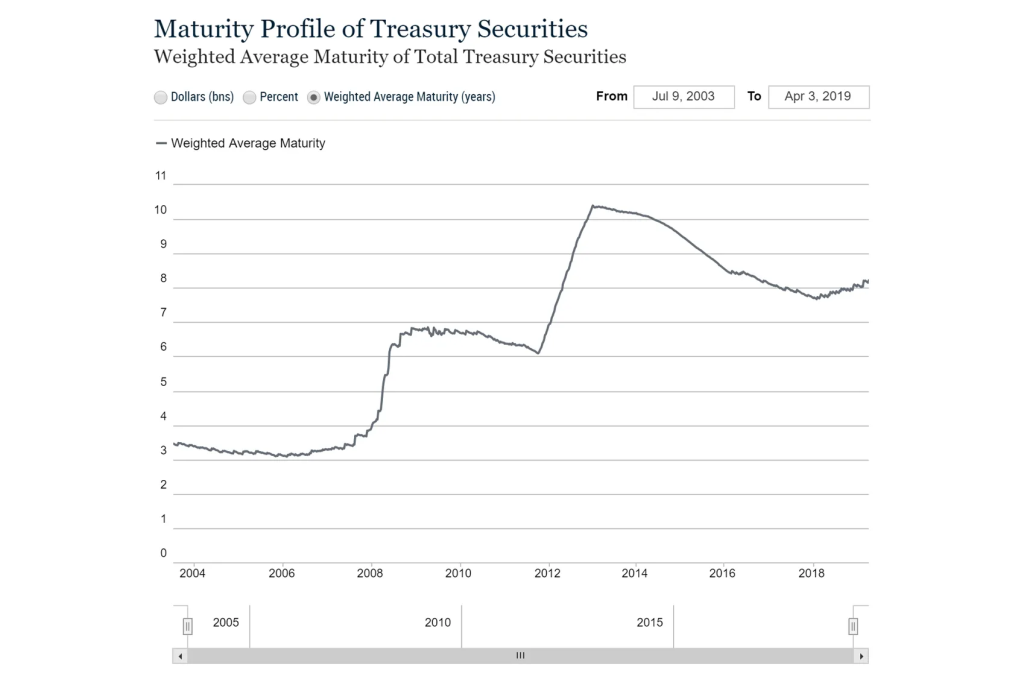
Chart from the New York Fed’s new interactive on the SOMA. This chart depicts the weighted average maturity of total Treasury securities over time.
Portrait of the Liabilities on the Balance Sheet
Relevant Report Pages: 34–38
Turning to the other side of the balance sheet, the Fed’s assets are funded by a variety of liabilities and capital. Those liabilities provide safe and liquid assets for the public, the Treasury, and the banking system.
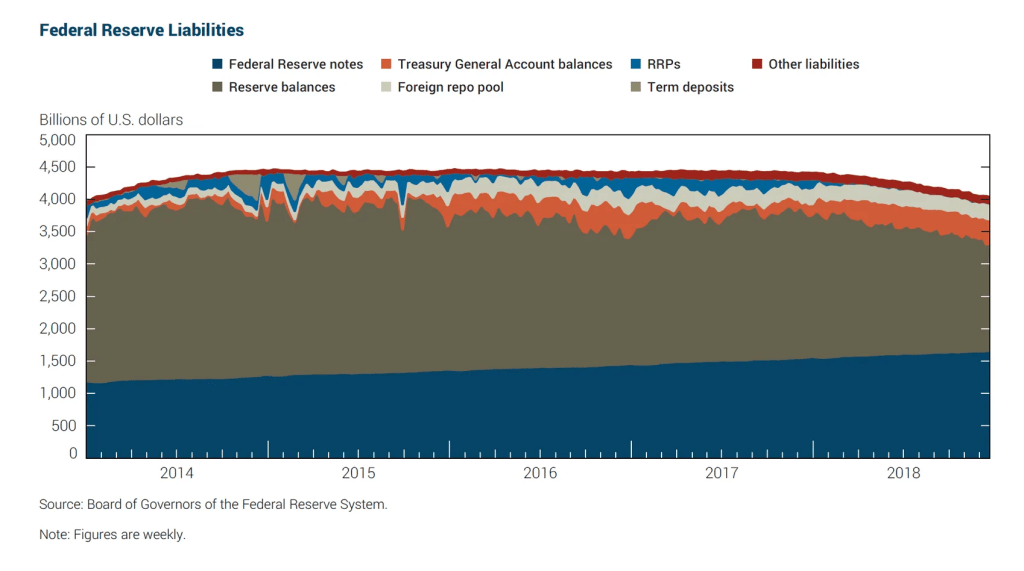
Chart 21 from the Annual Report, depicting the composition of Federal Reserve liabilities over time.
During 2018, reserve balances of depository institutions, which had been the largest Fed liability since October 2009, declined to a level similar to that of currency in circulation. This historically tends to be a central bank’s largest liability. The level of reserve balances has declined significantly from a peak of roughly $2.8 trillion, reached in October 2014, to about $1.6 trillion at the end of 2018. About a third of this decline is attributable to domestic securities holdings runoff, with the remainder owing to growth in liabilities other than reserves.
The aggregate increase in liabilities other than reserves stemmed largely from growth of currency in circulation — that is, U.S. dollar paper currency — and an increase in the Treasury General Account (TGA), the account used by the U.S. government to receive and make payments, including those related to taxes and debt financing. In recent years, the rate of growth of currency has generally reflected the pace of expansion of economic activity, though it has also fluctuated somewhat with a variety of factors other than economic growth, such as demand for U.S. currency in some emerging market economies. TGA balances have increased considerably over the past decade, and the TGA has exhibited significant variation in recent years.
For more detail and data about the SOMA, please visit the New York Fed’s website.
This article was originally published by the New York Fed on Medium.
The views expressed in this article are those of the contributing authors and do not necessarily reflect the position of the New York Fed or the Federal Reserve System.
