


In recent months, there has been a lot of discussion around the normalization of the Federal Reserve’s balance sheet. As policymakers continue their discussion of potential reductions in the Fed’s securities holdings, questions frequently arise on what the balance sheet might look like in the future. In particular: How big will it be?
A recent speech by Senior Vice President Lorie Logan, who heads the Market Operations Monitoring and Analysis function in our Markets Group (what we call MOMA or is more commonly known as the Open Market Trading Desk) and also serves as Deputy Manager of the FOMC’s System Open Market Account (also known as SOMA — we like acronyms), explored this question in the context of monetary policy operational frameworks. In her remarks, Lorie describes what the framework for implementing monetary policy looked like before the crisis and what it looks like today, including how well it’s working to maintain the effective federal funds rate in the FOMC’s target range.
Lorie also considers what the balance sheet and open market operations could look like in the future. She focuses in particular on how trends in the Fed’s liabilities will shape the size of the balance sheet. I’ll let Lorie explain:
The FOMC’s statement on Policy Normalization Principles and Plans notes that in the long-run, the FOMC intends to “hold no more securities than necessary to implement monetary policy efficiently and effectively.” It is challenging to determine far in advance what balance sheet size would accomplish this objective. However, it is probable that the normalized balance sheet will be considerably larger than its pre-crisis level, even before considering the volume of reserves that the FOMC would decide to supply. The reason is that recent growth trends in the Federal Reserve’s non-reserve liabilities will augment the necessary size of the normalized balance sheet independent of the operational framework adopted by the FOMC in the long run. To understand this point, it’s useful to consider the liability side of the Federal Reserve’s current balance sheet.
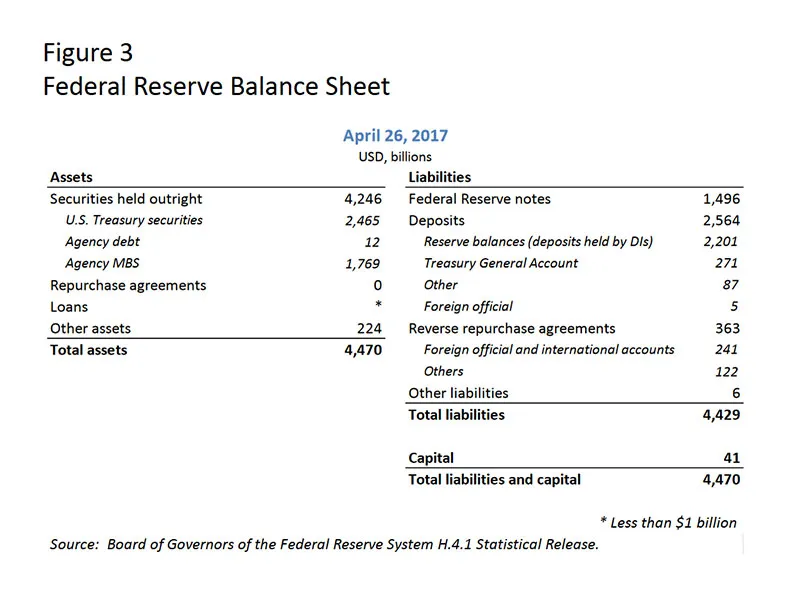
First, currency in circulation — a central bank’s traditional liability — remains a large and growing balance sheet item. Federal Reserve notes outstanding have nearly doubled since the start of the crisis, with a current level of about $1.5 trillion, implying that currency demand alone requires a much larger balance sheet than before the crisis. A simple assumption is that U.S. currency in circulation will grow in line with nominal U.S. GDP growth. However, it is easy to imagine shocks that could materially affect currency growth, either positively or negatively. For example, with heavy usage of U.S. paper currency overseas, demand for dollars appears sensitive to changes in global growth and financial and geopolitical stability. In addition, it is hard to know what longer-term implications financial technology will have for currency demand.
Second, the U.S. Treasury holds cash balances at the Federal Reserve in the Treasury General Account (TGA), its primary “checking account.” Before the crisis, Treasury targeted a TGA balance of $5 billion on most days; those balances increased during the global financial crisis. In May 2015, the Treasury announced plans to hold a level of cash generally sufficient to cover one week of outflows to help protect against a potential interruption in market access. Since that cash management policy went into effect, TGA balances have averaged around $250 billion, reaching as high as $440 billion.
Third, designated financial market utilities (DFMUs) can now establish and hold cash deposits in Reserve Bank accounts. The buildup of DFMU balances has prompted “other deposits” on the Federal Reserve’s balance sheet to grow steadily over recent years to a current level of about $85 billion, compared to a pre-crisis average of less than $1 billion. The other deposits category also includes balances held by GSEs and international and multilateral organizations.
Fourth, the Federal Reserve has long offered an overnight repurchase agreement investment to foreign official and international account holders — a service known as the foreign repo pool. The foreign repo pool has grown from an average level of around $30 billion before the crisis to an average of about $250 billion now. The rise reflects foreign central banks’ preferences to maintain robust dollar liquidity buffers, reduced availability of alternative low-risk investment options with private counterparties, and the New York Fed’s removal of constraints on account holders’ ability to vary the size of their investments.
Having run through some of the key non-reserve liabilities, Lorie explains how these factors need to fit into any projection of a normalized balance sheet:
In projecting the size of the normalized balance sheet, one can make assumptions about the long-run trends that will determine future levels for each of these non-reserve liabilities, subject to various kinds of uncertainty. Even taken at today’s levels, the TGA, other deposits, and the foreign repo pool alone account for about $600 billion of the Federal Reserve’s current balance sheet size. Adding on currency outstanding brings this set of non-reserve liabilities to $2.1 trillion today, and this set is likely to grow as the economy continues to expand. This sum does not yet consider reserves or ON RRPs.
The ON RRP facility, which has averaged around $165 billion this year, is another non-reserve liability that one might need to factor into balance sheet projections. The FOMC has said that it plans to phase out the ON RRP facility when it is no longer needed to help control the federal funds rate. However, as mentioned earlier, the facility has been a useful shock absorber amid structural changes in money markets, and it may be that some such facility would be helpful in maintaining effective interest rate control should the FOMC decide to remain in a floor system in the longer run. Of course, a decision to maintain an ON RRP facility would require longer-term choices about counterparty relationships and consideration of possible financial stability risks.
At this point, Lorie moves on to reserve balances — or, banks’ deposits held at the Fed — to complete the picture:
Finally, to complete projections for the normalized size of the balance sheet, we must consider reserve balances, currently the Federal Reserve’s largest liability. Two components will help shape the long-run level of reserve balances: banks’ demand for reserves and what, if any, additional supply of reserves might be deemed appropriate for the efficient and effective implementation of monetary policy.
The precise shape and position of banks’ demand curve is not currently known, but we generally understand the key forces that are likely to influence it. Changes in bank liquidity regulation and supervision since the crisis will be particularly important. In this new environment, we will need to consider the relative attractiveness of rates paid on reserves and close substitutes, such as Treasury securities, as well as banks’ propensity to substitute between these assets in meeting their liquidity requirements. Other characteristics of reserves may boost their inherent appeal — for example, intraday liquidity that supports clearing and settlement activities, or perceptions that holding reserves makes an institution safer. These factors are likely to contribute to higher and more variable demand for reserves than banks had before the crisis. If the demand curve for reserve balances has indeed shifted out, then a greater supply of reserves will be needed to attain a given interest rate target.
Moreover, it is important to take into account how uncertainty and increased variability in the non-reserve liabilities I’ve discussed could warrant an additional supply of reserves.
For example, TGA balances exhibit significant day-to-day variation stemming from the settlement of securities and the receipt of tax payments. All else equal, changes in non-reserve liabilities have the opposite effect on the supply of reserves. What these variations will mean for the amount of reserves the Federal Reserve decides to supply — and also for the size of the normalized balance sheet and the types of open market operations that will be employed — will depend heavily on the operational framework the FOMC chooses in the longer run.
Lorie then turns to how this variability might be treated under different types of policy implementation frameworks that the Fed might choose in the long run.
For context, the Fed currently uses a floor-style system, which allows us to change short-term interest rates while maintaining an abundant supply of reserves. Before the crisis, we used a type of corridor system, which was based on reserve scarcity. (When reserves are scarce, the supply of reserves is located where the demand curve slopes steeply downward, and small variations in the supply of reserve balances produce sharp moves in interest rates. But when the supply of reserves become plentiful enough, banks’ demand for reserves flattens out, and interest rates become effectively insensitive to shifts in reserve supply.)
Lorie describes the resulting implications for the balance sheet’s size:
To remain in a floor system, the Federal Reserve would need to supply enough reserves to satisfy bank demand along the flat portion of the reserves demand curve. It would also need to ensure that even amid shocks to non-reserve liabilities, the supply of reserves would stay on the flat part of the demand curve. There are essentially three ways to accomplish that objective. First, as in the past, the Federal Reserve could establish limits for the overall size of or daily variations in non-reserve account balances. Second, the Desk could carry out open market operations to offset fluctuations in reserve-absorbing factors, similar to what we did in our pre-crisis framework but at a lower frequency. Third, the balance sheet could include an additional buffer of excess reserves sufficient to ensure that most shocks would still leave us safely to the right of the steep part of the demand curve. Providing this additional buffer would require that the Federal Reserve retain a corresponding amount of assets.
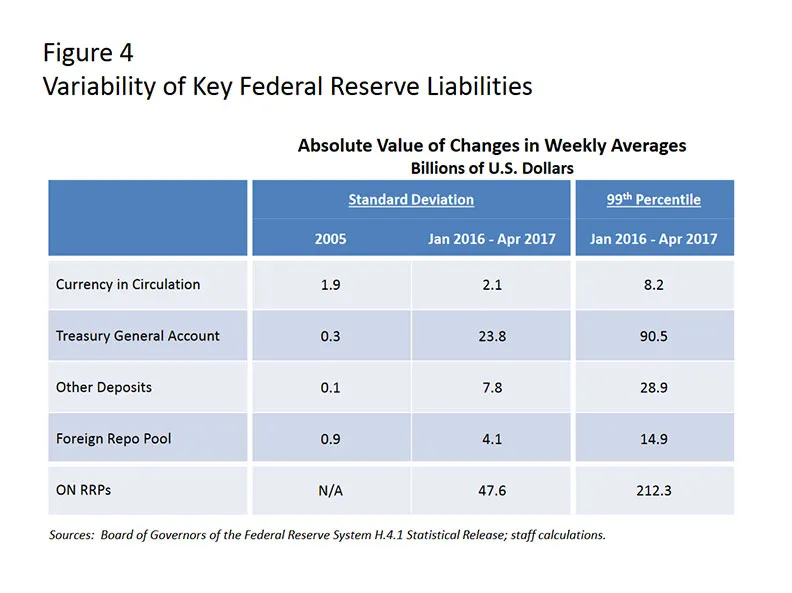
An important trade-off in a floor system arises between the size of that additional buffer and the frequency and size of open market operations. In the current floor framework, the buffer is more than large enough to absorb shocks without the need to conduct offsetting open market operations. In fact, the level of reserve balances has fluctuated by as much as $700 billion since the start of 2016 with no material impact on federal funds market dynamics. To project the balance sheet’s long-run size, one could try to estimate the size of a conservative buffer by examining the distribution of changes in currency, the TGA, other deposits, and the foreign repo pool. Data since January 2016 suggest an additional buffer of reserves of about $145 billion would absorb 99 percent of changes in the daily average holdings of these liabilities from week to week (Figure 4 — above). Accounting for variability in ON RRPs could add another $215 billion to the buffer.
In a floor system with a buffer that would sufficiently accommodate swings in non-reserve liabilities, IOR would continue to be the primary tool to maintain interest rate control, perhaps supported by ON RRPs if needed. In addition, the Federal Reserve would still need to conduct some reserve-adding open market operations, but only periodically, to accommodate trend growth of balance sheet items like currency; otherwise, the quantity of reserves would eventually be smaller than that needed for efficient and effective policy implementation.
However, if the FOMC wanted to maintain a somewhat smaller balance sheet, it might prefer to operate a floor system with a smaller buffer. In this case, the Desk would have to use regular reserve-adding open market operations to offset transitory shocks to reserve-absorbing factors in addition to secular trends. The smaller the buffer, the more the Desk’s operational schedule and supporting analysis would need to focus on short-run changes in demand for the Federal Reserve’s liabilities.
Returning to a corridor system, in which we operate on the steep part of the demand curve, would mean an even smaller balance sheet. Daily forecasting and frequent open market operations would once again be required to manage the supply of reserves in the face of either reserve-adding or reserve-absorbing shocks in order to maintain interest rate control.
And Lorie concludes on the matter:
One could put together all of these elements — one’s projected levels for the range of non-reserve liabilities and assumptions about the supply of reserves — to arrive at some rough estimates of the range of balance sheet sizes that would be required under these different operational frameworks. However, the uncertainties surrounding these factors at this stage are very large. Furthermore, the variability of these factors over time suggests that the size of the balance sheet that best balances the trade-offs will evolve as the structure of money markets and other factors change. In practice, it will likely be necessary for the Federal Reserve to closely monitor the behavior of money markets as its balance sheet shrinks, and to use that information to enhance our understanding of the evolution of the demand for reserves and the other, non-reserve liabilities.
Any discussion of the future size of the Federal Reserve’s balance sheet must include an understanding of the Fed’s non-reserve liabilities and how its reserve liabilities might be considered under different long-run policy implementation framework options. With that, one could begin to imagine what a “normalized” balance sheet might look like in the future — and how it might differ from the past, particularly before the financial crisis.
For those who are interested in learning more, give the entire speech — in which you can also find relevant citations — a read.
Also, should you be curious for a more in-depth discussion of the factors affecting reserve balances, take a look at the Fed’s H.4.1 statistical release — and useful companion guide to understanding the factors therein — for more information.
Finally, for further detail on the SOMA portfolio, take a look at the SOMA Annual Report (officially titled Domestic Open Market Operations During 2016) and its underlying data.
This article was originally published by the New York Fed on Medium.
The views expressed in this article are those of the contributing authors and do not necessarily reflect the position of the New York Fed or the Federal Reserve System.
